


Honing in on the Vaccine Kill Zone
Latest Mortality Stats from Australia

The latest monthly Provisional Mortality Statistics update was published by the Australian Bureau of Statistics today. They are three months behind the fact and I like to run a funeral index derived from online listings of funerals in one state, Victoria, to see how deaths are going NOW. The deaths are running above the index. This may be because Victoria was having fewer deaths in the beautiful weather of March, or because, with covid easing, fewer funerals are being listed online. Here is the graph with a Victorian comparator to the end of 2022 beside it, where it makes more sense (the bubbles are during the lockdown periods)…

Regulars will note that I have extended the “If Covid never existed” Baseline back to the beginning of 2015. The annual seasonal pattern is derived solely from the deaths over the 2015-2019 years. The accumulated excess deaths (from January 2015) look as follows…

If Covid (the combined bioweapon event of novel virus + vaccines + public health measures) had never happened we may have had ~10,000 fewer deaths than we have today.
In a population of 26 million death is fairly steady, with only the onslaughts of the “cough and fever” of the winter months creating the seasonal effect. In the graph below, note the variations across 2015-19, and the bizarre points from late 2021 through to March 2023, against (Doctor-certified) deaths registered to “Influenza” and “Covid”…

Note that the bubbles to the cause of death of “Influenza” are very small. If a person with Dementia, who has lost a lot of muscle control, has trouble eating, gets the flu leading to pneumonia and sadly passes away, did they die of Dementia, Pneumonia, Musculo-skeletal Weakness, Malnourishment, or Influenza? It could be any of the above. The same goes for people suffering end-of-life cancer, who get the flu, and sadly pass away. Did they die of cancer, or the flu? This illustration of Doctor-certified deaths to specific causes illustrate that in a bad ‘cough and fever’ year, deaths to all the principle underlying causes increase….

There is a bubble year in 2017, where even the generally stable, unseasonal cause of cancer saw a small uplift in attributed deaths. More people died of “Dementia and Diabetes”, more died of Ischaemic and Other Cardiac events, more died of Cerebrovascular events, and more died of “Other” - a particularly large category of diverse and specific causes of death (but none relating to coroners - these are only doctor-certified deaths).
Note that trends in deaths to Cancer, Dementia and Diabetes, and Other are increasing, while trends in Circulation deaths (Heart, Cerebrovascular) are decreasing. Over the years 2009-2019 (before covid) there had been a net decrease in the age specific death rates.
The next point that’s important to see is just how flat the deaths were in 2020. The seasonal bubble came primarily from Covid in the state of Victoria. Australia locked down ALL OVER in late March/April to May of 2020. Planes were stopped. “Cough and Fever” reported on the flu-tracking website dropped to near-zero. Historical lows were reached by a huge margin. It’s astonishing that the seasonal patterns in Deaths in all the other causes nearly vanished (to be shown in a later post). THESE HISTORICAL LOWS of 2020 “Cough and Fever” CONTINUED well into 2021. There was almost zero “Cough and Fever” and the deaths should have been almost as flat. And yet the actual deaths of 2021 seem to follow the seasonal pattern. This is the Vaccine Kill Zone. And when I say that I mean the easily visible, rather rapid deaths - not those that result from a steady weakening over months, unlikely to be reported as vaccine deaths.
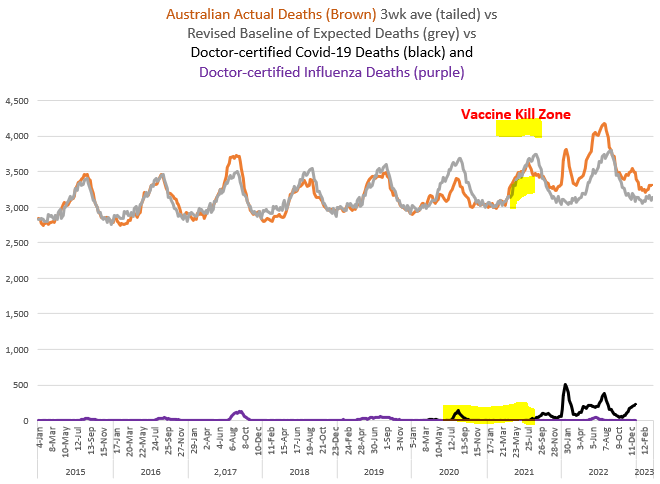
NB: Doctor-certified deaths regularly represent ~87.7% of the total deaths. The Coroner does all the deaths resulting from accidents, or deaths under suspicion (eg home alone deaths), and deaths where the Doctors have trouble determining the medical cause. Here is a graph of Doctor-certified deaths vs many of these variables discussed, with the beginning of the Vaccine Kill Zone indicated…

The deaths should’ve remained almost flat across May to July - perhaps a slight increase as the frail elderly, saved from “Cough and Fever”, slowly came to their time - with a small bubble due to covid later in the year. Such was not the case, and this needs a lot of analysis. See next post.
It appears the coroner is being given more “medical” deaths to sort out, unless “accidents” have suddenly increased, or more people are dying strangely alone at home…

Thoughts, while waiting for the next post?
Thank you.