A week before the submissions were due (a Friday) I decided I needed to commission more data from the Australian Bureau of statistics, at an additional cost of $641. I received the data very quickly, on the next working day (Monday).
Yet it was so rich I wasn’t able to process it all before the due date. The kind staff of the Senate Standing Committee on Community Affairs gave me a week’s extension. I could barely put it together and send it off.
You know me - I didn’t proof read it until a couple of days later. It was absolutely shocking! So I sent a Revised Submission, and pleaded that they not try to make sense of the first one.
Anyway, new data… please enjoy it. You have to get through the Executive Summary first to get to “Background” to see what I actually purchased.
Committee Secretary Senate Standing Committee on Community Affairs PO Box 6100 Parliament House Canberra ACT 2600
REVISED Submission and evidence to the Excess Mortality Inquiry
My professional working life in the Actuarial Science departments of Life Insurance companies included the evaluation of excess mortality in pooled funds. I completed actuarial subjects on mortality statistics and life contingencies.
I left paid employment prior to marriage and have pursued many lines of independent research over the last 30 years, as a voluntary community service.
2. Executive Summary
We spent billions of dollars tointentionally modify our health environment, through lockdown, border closures, quarantine and other measures, through 2020 and 2021.
The seasonal respiratory and other infectious agents all but vanished, with positive flow on effects to many other underlying causes, over these two years.
These billions of dollars shifted the baseline of expected deaths, in a discontinuous manner, and neither the Australian Bureau of Statistics nor the Australian Institute of Actuaries Covid-19 working group (last I looked), using smooth progressive baselines, adjusted for it. Baselines that smoothly project from the past do not allow for these suddenly altered circumstances.
The shift has been persistent, with many associated infection-limiting behaviours remaining.
As such, the ABS and AIA analyses greatly under-estimate excess mortality, and fail to draw out the principal causes.
After Infection Control, there was a second major health initiave with the population-wide deployment of covid-19 vaccines. There is a sudden discontinuity in the death data from this time:
Two methods of analysis have been employed to evaluate Excess Mortality.
1. The scientific method was employed in casting a new baseline for the changed health conditions.
In this model it was assumed that the vaccines were safe and effective against death, thus employing the scientific method to prove it wrong, if so.
This assumption is being made, despite the multiple avenues of indirect observation pointing to these vaccines as a force of death (well beyond that acknowledged by the TGA) including the following:
The TGA’s DAEN database has 747 suspected covid-19 vaccine deaths listed for 2021. They acknowedged only 15, but over 6,000 people appear to have died from the vaccine health measure in 2021 alone.
In the 2020/21 AIHW data the vaccine-related “Principal Diagnoses” were 40x higher than usual in the adult age groups, up to 30 June alone. The 2021/2022 numbers were further magnified. The numbers were higher again in the “Admitted patient care” data.
With the assistance of the Customised Data, purchased from the ABS, the assumption that the vaccines were safe and effective against death was proved wrong.
It was possible to construct a Baseline for 2021 using the experience of 2020, and the excess deaths by this method were 6,669 for 2021 alone from the end 2020 starting point.
For 2022 and 2023, after Australia opened up, and Covid-19 transmitted freely, there was no experience on which to base a new expected outcome. It wasn’t possible to construct a Baseline of expected deaths for this unknown territory, given the slow acquisition of population immunity to a novel disease, in a health environment grappling with vaccine-related death, also on an unknown trajectory.
Thus, I compared 2022 and 2023 to the same baseline used in 2020 and 2021. On this basis the total Excess Mortality reached 42,762 lives. This compares with the 49,400 on the “Observation and Deduction Method”, albeit this could be reduced to account for lower Influenza & Pneumonia, as explained.
2. Through the Observation and Deduction Method, excluding all possible deaths related to Covid-19 or to Influenza or Pneumonia (obtained through Customised Data obtained from the ABS (ABS 2024), there were
· no excess lives lost in 2020 (on Trend), but
· 7,345 excess lives lost in 2021,
· 11,462 in 2022, and
· 8,657 in 2023,
totalling 27,464 excess lives lost to causes other than those related to Covid-19, Influenza and Pneumonia -related causes. There is no attribution cause for these deaths other than the vaccines.
Covid-related causes add another 21,936 deaths to the total, bringing it to 49,400 deaths, but this total could be ameliorated by allowing for the reduction in Influenza and Pneumonia -related deaths.
Summary
The Pandemic Excess Deaths (2020-2023) sit somewhere between 40,000 to 50,000. Well over half of these deaths are the consequence of the vaccines.
I note that I haven’t had time to address questions related to the attribution of deaths Covid-19 itself, including those related to the medical failure to treat to prevent, and to treat to mitigate illness.
I’ve addressed questions relating to the safety of the vaccines, but not those related to the efficacy. It is clear there was no efficacy against Death, particularly in the Aged Care residencies in Melbourne for which there are three studies, one before and two after vaccine administration. Together they demonstrate NO STATISTICAL BENEFIT against Death in the frail aged of 2 doses of covid-19 vaccines compared with no doses, over the Delta outbreak (late part of 2021). The studies did not include deaths to vaccines in their analyses, nor examine why their no-vaccination cohort had refused (very close to death).
Finally, there is a disgraceful lack of transparency on all the necessary vaccine-related data, and has been throughout the pandemics. Neither science, nor democracies, can operate without information. With transparent data little of this analysis and deductive reasoning would’ve been required. I repeatedly asked for data, and was denied. I consider it a crime.
Contents:
Background
1. Baseline and Scientific Method
2. Observation and Deduction Method
3. Additional Discussion
Please contact me for further data or inquiries about this work.
Thank you for the opportunity to contribute.
Yours faithfully
Madeleine Love
Background
The modification to our health environment is firstly evidenced by the historical fall in “Fever and Cough” respiratory symptoms, persisting from the first lockdown in 2020 to the end of 2021, reproduced here from the Australian FluTracker network (right) for analysis. People stopped coughing, until the covid omicron variant arrived.
In the graphic below, observe that this %Fever&Cough series has historically represented the death curve (when converted to a natural exponential and expressed as a percentage of the susceptible >75 population). The size and shape of the % Fever and Cough line represents the seasonal deaths over 2015-2019. The new health environment led to a discontinuous and persistent change, from lockdown late in March 2020.
Customised ABS data on Influenza, Pneumonia and Covid was purchased to evidence the persistent modification to our health environment. The brief was “All possible Covid-associated deaths, underlying and associated causes”, and “All of the remaining Influenza & Pneumonia deaths, underlying and associated causes (excluding any covid-associated deaths)”. The data is seen visually in the following graphic, and in numbers in the graphic below:
For Covid, this included hundreds of related deaths with the codes
· U08: Personal history of COVID-19, and
· U09: Post COVID-19 condition (U09).
Nonetheless most of the Covid-related deaths were given the status “Underlying” – the main cause.
In contrast, most of the Influenza & Pneumonia related deaths were associated with other Underlying causes. Most of these deaths were Pneumonia – Organism unspecifed (J18).
1. Baseline and Scientific Method
Developing the Right Baseline for Assessing Excess Mortality
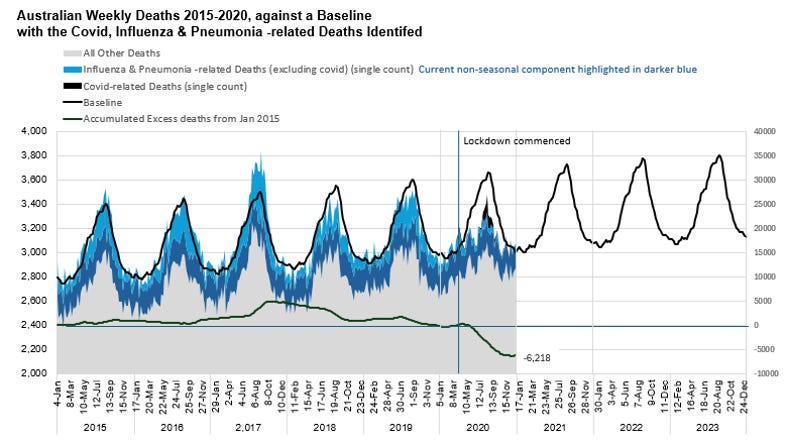
At the end of 2020, after spending billions of dollars, Australia had saved thousands of lives (the model below predicts 6,119 across the calendar year of 2020, and the accumulated excess at the end of the 53 week year sitting at 6,218). These lives weren’t saved from ‘covid’, but rather from avoiding many of the forces of death.
(This Baseline model projects the past into the future with the assumption that the (2009-2019) derived age-specific mortality rates will continue for each age on the same trends (incorporating continued health and medical advances). They were applied against the averaged quarterly single age populations, against. It used the distribution shape from the 2015-2019 average.)
Deaths greatly exceeded the Baseline in 2017, and they were recouped against the Baseline by end of 2019, as mathematically organised. The Baseline is similar to the ABS’s (but a little higher I think).
The Baseline was useful for identifying the 6,135 lives saved, but that is the end of its use. It can’t be used into the future because the health conditions changed radically, and in a discontinuous manner. The assumptions behind the mortality rates were now false for 2021. The Baseline needs to be recast for 2020, 2021 and into the future.
Recasting the Baseline
Recast Assumptions
Infection Control: Looking into the future, from the end of 2020, it is known that the % Fever & Cough index continued at historical lows, that the usual seasonal element of Influenza and Pneumonia was absent, and that the non-seasonal element was reduced. The health interventions remained throughout with additional lockdowns occurring. Working from home continued, with less traffic on the road and weddings deferred. Large scale entertainment was limited. From an inter-human infection (and accident) viewpoint the conditions were similar to 2020.
Vaccines: There was a second population-scale novel health initiative for 2021 – that of the introduction of the Covid-19 vaccines.
For the sake of the scientific method this model assumes the Covid-19 vaccines were “safe and effective”.
With respect to the safety, the TGA has acknowledged 15 deaths in 2021 – tiny in the big picture. This model assumes that any lives lost to the vaccines were insignificant in the big picture.
Regarding effectiveness, this model assumes the widely promoted claim of “efficacy against death” to be true. We do know that there were a small number of covid deaths in the later part of the year in the vaccinated population. Thus, these deaths will be counted as ‘excess’ since the model assumes the vaccines were effective.
Demographic Consequence: In consistent health conditions it is typical that a year of above average excess death will be compensated by a year (or two) of lower death. There are many examples of this in our national and state statistics, particularly after bad regional flu years. However, I haven’t seen the reverse situation, where a year of less death results in more the following year. Indeed, if a good year was always followed by a bad, there wouldn’t be the ongoing improvement in life expectancy. In 2020 lives were ‘saved’ across all age groups (below), compared with the Baseline model. The 6,119 people who didn’t die as expected in 2020 are not necessarily frailer for having avoided mortal risk (particularly those in the 45-64 age group). They will nonetheless face higher risks of death due to age, and the baseline will implicitly allow for this, since these people are in the populations.
Summary: The overall assumption is that the health environment will be very similar to 2020. The ‘saved’ lives will be included in the calculation of risk.
Adjustments to the previous baseline.
A similar form of baseline was developed for the six states, their excess calculated, converted to standard deviations and compared. The reduced curves of the states other than Victoria were very similar. A consensus curve (ex Victoria) was developed for 2020, weighted by the population of the remaining five states.
There were some gaps filled over weeks 10-16, and a three-week average was used.
With the Baseline Recast for our new Billion-$ health conditions, the accumulated deaths at the end of the 53rd week of 2020 are recalculated to be -488. The adjusted Baseline still seems high, but it’s adequate.
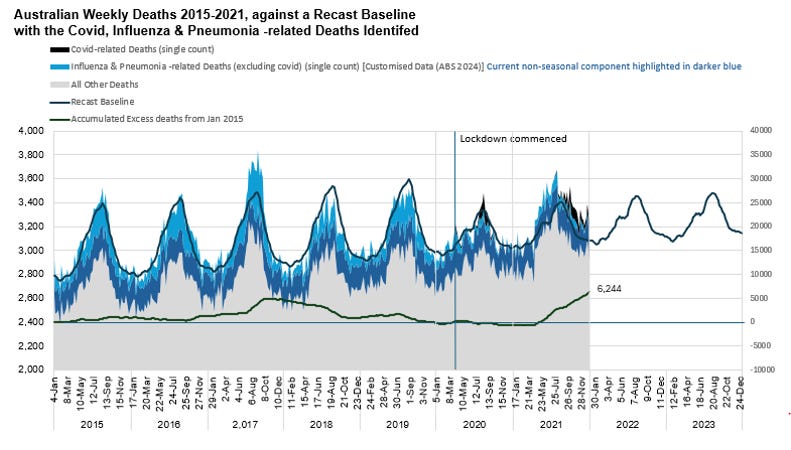
Excess Mortality for 2021
The revised model predicts 6,669 excess deaths for the calendar year 2021, with the accumulated excess (since 2015) now at 6,244.
Note there is a discontinuity in the deaths in March-April. Note how the “All Other Deaths” are pushing up against the Baseline for 2021. And in the following graph, with the “All Other Deaths” now highlighted in orange, note when the Suspected Vaccine Deaths began to be reported to the TGA’s DAEN. The TGA might like to deny the vaccine cause, but that surge in “All Other Deaths” is very real.
As such,
· with All Possible Covid, Influenza & Pneumonia -related deaths excluded,
· with the improved health conditions continuing into 2021, and
· with all the lives ‘saved’ from the improved health conditions in 2020 built into the populations at risk for the 2021 Baseline,
the rise can only reflect the consequences of vaccine injury. The “safe” assumption of the Covid-19 vaccines fails.
Further two Victorian studies reported on the deaths of aged care residents in the Delta outbreaks in the later part of 2021. The rate of dying among the twice vaccinated was not statistically different from their (frailer) unvaccinated counterparts, and the rate was no different from the pre-vaccination outbreaks in 2020. The vaccines were clearly not “effective against death” for those most likely to die.
Excess Deaths for 2022 and 2023
It wasn’t possible to construct a Baseline of expected deaths for this unknown territory over 2022-2023, to allow for the slow acquisition of population immunity to a novel disease, in a health environment grappling with vaccine-related death on an unknown trajectory.
The % Fever&Cough index went wild, now including Fever and Coughing from Covid. Despite the visual match between the coughing and the deaths there is no historical record of how this index relates to death from Covid-19. I suspect the relationship is changing over time, as people aquire immunity.
As such, I kept the recast “low infection, good health” Baseline to look into the future.
Previously steady and on-trend, even through 2020, note that the “All Other Deaths” continue to push up against the Baseline. With All Possible Covid, Influenza & Pneumonia -related deaths excluded, the rise will reflect the consequences of vaccine injury.
Allowing for the -488 excess deaths at the end of 2020, by the end of 2023 there were about 43,000 excess deaths over the 2021-2023 period, on this ‘low infection, good health’ baseline.
All the possible covid-related deaths only amounted to 21,936 since the end of 2023. The remainder would be vaccine-related deaths, although Influenza & Pneumonia increased a little more from the 2020-2021 period. That said, however, many of the Suspected Covid-19 Vaccine Death Reports on the TGA’s DAEN include pneumonia and influenza-like illness as reported reactions. Here is a sample of the first 30 reports made:
2. Observation and Deduction Method
The % Fever & Cough graph has been overlaid in the figure below. Observe how the Influenza & Pneumonia related deaths trail the %F&C peaks by 2-3 weeks, in contrast with Covid-related deaths, which don’t.
Also observe that for Influenza & Pneumonia -related deaths, the previous seasonal component (the peaks) vanished for 2020 and 2021, and the non-seasonal component (the troughs) dropped.
In this next graph observe that, when the Influenza & Pneumonia -related deaths declined after lockdown in 2020, they did so because their major Underlying causes declined. The exception was diabetes.
Prior to 2020, deaths to underlying causes moved up and down with the seasons, together, all extending in amplitude, for example, when flu was at its worst (2017) and contracting in the smaller season of 2018. The % Fever & Cough index could be readily placed on top of this graph as well.
Note the chaos after lockdown, with Pneumonia plunging the furthest.
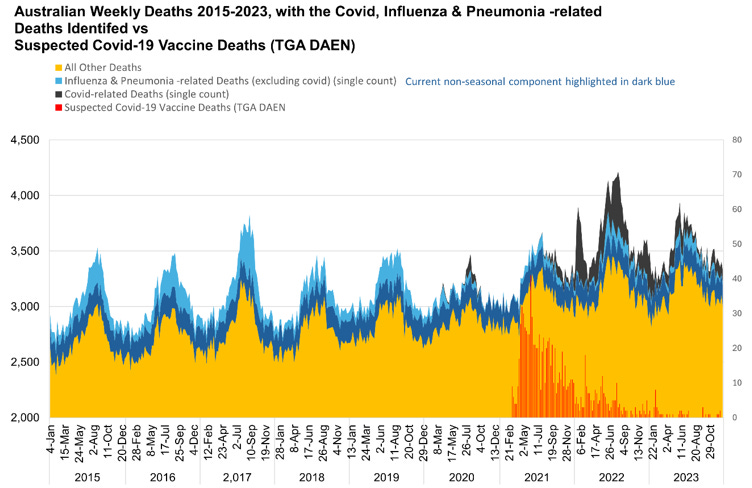
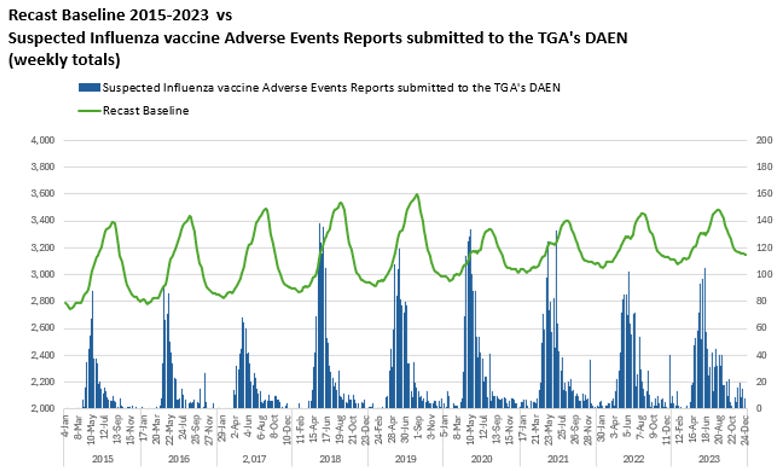
In the following graph these Covid, Influenza & Pneumonia deaths are highlighted against “All Other Deaths”.
Observe the discontinuity in Mar/April 2021, as the broadscale deployment of vaccines begins.
Also observe that this sudden rise in deaths exactly coincides with the Suspected Vaccine Adverse Events (Death) Reports recorded on the TGA’s DAEN data (red).
There was a sudden leap in “other cause” deaths, in contrast to previous years where seasonal deaths emerge more slowly, and with typical influenza & pneumonia related causes.
While the TGA may want to deny the cause, the leap in deaths is real. Given these >1,000 of additional deaths HAVEN’T been listed as vaccine deaths, the causes of the increase in “Other Deaths” will to be examined.
NB: Observe the vaccine adverse event reports submitted to the TGA DAEN’s database in the following graph:
Looking at the Figure above, the analyst will see that the “other cause” deaths in 2018-2019 increase more suddenly than those across 2015-2017.
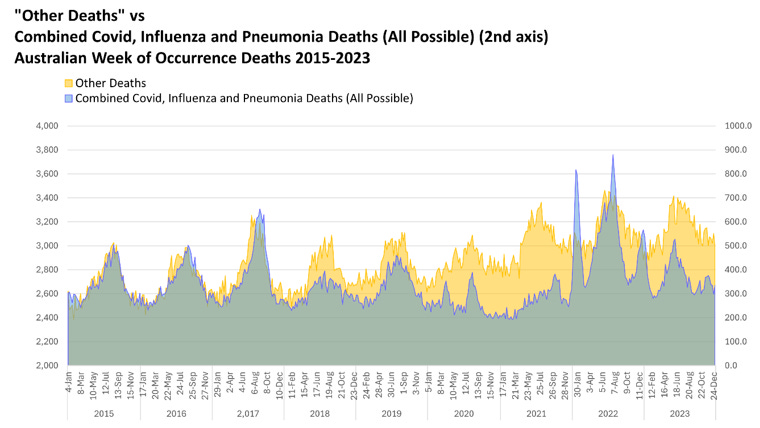
In the graph below there is a lot to observe in the comparison of the Covid, Influenza & Pneumonia deaths with all “Other Deaths”.
Across the years 2015-2019 (no covid), the Influenza & Pneumonia -related deaths come to a single peak.
The “Other Deaths” tend to have a flatter maximum with an earlier peak.
The Influenza & Pneumonia deaths form a lower proportion in 2018-2019. After the big 2017 flu year measures were introduced to improve infection control, and vaccines were changed and increased.
Despite the “Other Deaths” appearing reduced in 2020, in fact the numbers are exactly on-trend with the 5 years before. The curve was simply flatter.
In contrast, the “Other Deaths” across 2021-2023 were thousands of deaths off-trend.
Finally note that these curves bear no resemblence to the covid curves. They are disjunct, fully supporting the assumption that the All possible covid deaths have been included in the Customised Data provided by the ABS (ABS 2024).
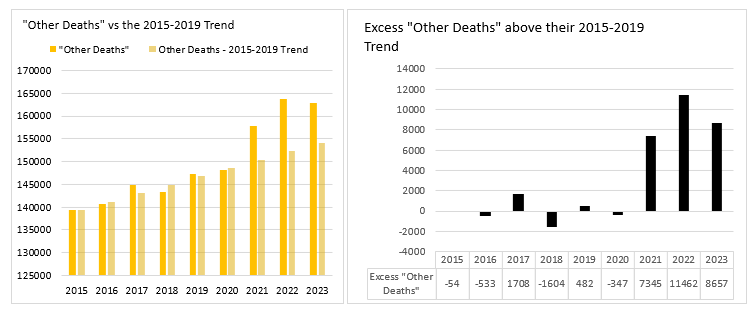
Excess “Other Deaths”
Observe that “Other Deaths” in 2020 (52 wk adj) were not in excess, positive or negative, to their 2015-2019 (linear) Trend. In fact the “Other Deaths” stay right on trend across 2015-2020 with only a small lift in the bad year of 2017, and compensation in 2018.
The excess begins in 2021, and it is substantial:
· 7,345 excess lives lost in 2021
· 11,462 in 2022 and
· 8,657 in 2023
These total 27,464 deaths. They are, through this method of excluding All Possible Covid-related deaths, expected to be associated with the vacccines.
Covid-related causes add another 21, 936 deaths to the total, bringing it to 49,400 deaths, but this total could be ameliorated by allowing for the reduction in Influenza and Pneumonia -related deaths.
That said, however, many of the Suspected Covid-19 Vaccine Death Reports on the TGA’s DAEN include pneumonia and influenza-like illness as reported reactions, as well as the aspiration and vomiting. (see section 1)
If these thousands weren’t coded as Vaccine Deaths, what cause/s were they coded to?
There were only 15 deaths coded to the Covid-19 vaccines as an “Underlying Cause” in 2021 (COVID-19 vaccines causing adverse effects in therapeutic use (U12)), and 4 as an “Associated Cause”. So, assuming this unexpected increase in deaths are the consquence of the covid-19 vaccines, where would they be coded?
Here is the 2021 update of the Doctor-certified Major Underlying Cause deaths (PMS), with excess from the trend in standard deviations. Most of the deaths (except diabetes) went lassez-faire in the low infection environment of 2020. Yet observe in 2021 they jumped back into tight formation. It appears the vaccine deaths were coded to all causes, but particularly “Dr Certified Other” (orange line), though leaving Pneumonia mostly behind due to the continuing low infection environment - Chronic Respiratory conditions likewise (probably for the same reason).
There was one Respiratory category, called here “Remaining Respiratory”, that leapt with the circulatory and other causes. The largest code in “Remaining Respiratory” is J69: Pneumonitis due to solids and liquids. I understand this illness is usually the consequence of aspirating/choking on food/liquid, and that it is associated with the very frail. It saw a sudden leap in Associated Causes in 2021.
Looking at the Dr Certified weekly death to “Remaining Respiratory” causes (only ~15% of the associated deaths) we see a profound alignment with the % Fever & Cough index throughout, except 2021, where the difference instead perfectly aligns with the Suspected Covid-19 deaths.
3. Additional Discussion
Observe that the 2018 and 2019 deaths related to Influenza & Pneumonia don’t match the shape of the % Fever and Cough curve. Rather, the %F&C curve seems to better match the “Other Deaths”, noting the 2018 “Other Deaths” are quite high.
Observe that the wiggle at the front of the %F&C curve appears to be growing in comparison to the later peak, across 2015-2019.
Given the themes here, I ask the question about the regular flu vaccines administered in autumn each year. The TGA’s Influenza vaccine suspected Adverse Events Reports are added to the graph below. Observe they coincide with the wiggle, and grow with it, as “Other Deaths” also grew in competition as the Influenza & Pneumonia -related deaths. We’re not saving I&P deaths by killing people early with the vaccines, are we?
Observe the Recast Baseline (low infection environment, good health conditions). In the absence of seasonal Influenza and Pneumonia the wiggle becomes prominent, here matched against the Flu vaccines adverse events reports:
Whatever is happening at this time of the year to kill people has been normalised. I think we need to collect data on post flu vaccine deaths.
GREAT work Madeleine 👏👏 ... The Excess Mortality Inquiry accepted my submission as correspondence only ... So to see your work published is extremely heartening. The tyranny rolls on of course, but to see such well researched data on the record lifts my spirits.


Thanks Madeleine.
Have you seen Norman Fenton's work about the 'disappearing Australian flu'? It would be interesting if you sent him this fever/cough info and you could work together. https://wherearethenumbers.substack.com/p/the-puzzle-of-australias-respiratory
Personally I have no skin in this, not wedded to any ideas or 'data.' I focus pretty much exclusively on the pandemic of tyranny.
GREAT work Madeleine 👏👏 ... The Excess Mortality Inquiry accepted my submission as correspondence only ... So to see your work published is extremely heartening. The tyranny rolls on of course, but to see such well researched data on the record lifts my spirits.