


Misattributed Vaccine Deaths
Circulatory system and "other" causes

The latest Australian Provisional Mortality Statistics were released last week, up to 30 April 2023. On my conservative “If Covid never happened” baseline* deaths are still running to excess (see the image at the end of the substack). But this baseline is not valid where the typical seasonal triggers of many causes of deaths - coughs and fever from flus and colds - are absent.
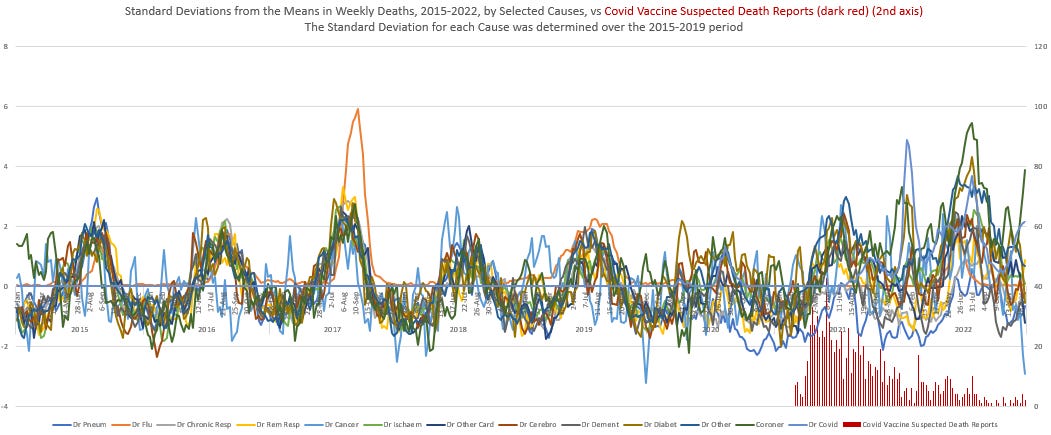
Take a look at the seasonal cohesion between multiple causes of death over the 2015-2019 period, and then see how this cohesion broke apart in 2020 in the near absence of respiratory triggers, as Australia locked down and shut its borders.

And then look at 2021, where this cohesion appeared to gather again, though still in the near-complete absence of any respiratory triggers - this is the vaccine kill zone (substack here), where people’s deaths were attributed to various causes, other than the vaccines. This is visualised below with the covid vaccine death reports submitted to the TGA (Australia’s drugs regulator)…
Take a look at this data behaviour in correlation tables for various time periods… The 2015-2019 table shows the standard associations between these various causes, with closer associations highlighted in darker blue. Compare it to the 2020 table

with the total lack of association between the causes as the usual respiratory triggers vanished, except between “Ischaemic” heart deaths and “Other” doctor certified causes. Then look at the associations for 2021, particularly the second last column on the right (or second last row in these two-way tables :) ). I call this the vaccine pattern of death attribution, with Doctor Certified “Other” deaths having particularly strong associations with Circulatory causes and lesser associations with Chronic Lower Respiratory and Remaining Respiratory causes. These vaccines had a particular impact on the circulatory system.
In 2022 a little influenza/coughs-and-fever returned with the opening of borders and relaxing of restrictions, and as such a shadow of the standard 2015-2019 association pattern returned, but the vaccine death attribution pattern with “Other Causes” is still there. This is the year where thousands of deaths were attributed to covid with the closest associations to dementia and diabetes deaths, perhaps in the high infection potential within aged care facilities, where for example doctors are compelled to determine whether covid or a progressive dementia killed their patient.
Take a look at the different segregation of deaths after 2019 to circulatory causes (highlighted in red) compared to deaths to respiratory causes (in blue), with Other doctor certified causes represented in orange…

Look closely into the vaccine kill zone of the first half of 2021… there is only one respiratory category that tracked along with the Circulatory system - this is the category of Doctor Certified “Remaining Respiratory” deaths. The two biggest causes in this category being
Pneumonitis due to solids and liquids (J69), and

Other interstitial pulmonary diseases (J84


In this time, where vaccines were administered to the frail elderly in aged care facilities, I see some residents having a bad reaction to the vaccines and choking on their own vomit. I wrote a substack about vaccine deaths in the frail elderly. I wonder if the J84 diseases relate to vaccinal spike-protein-caused microclotting. What do you see?
Now, see the visual of the Coroner Certified deaths (in Black) overlaying the other causes. The Coroner determines on accidental deaths, suspicious deaths or where a person died alone, and deaths where a doctor cannot determine the cause. Look at the acceleration of deaths in the Coroner category since the vaccine rollout began…

The Coroner peak in early 2022 came at a vaccine administration booster peak, foreshadowing massive peaks in deaths to Covid, and also, unseasonally, deaths “attributed to” dementia and diabetes, visualised here…

I have a feeling the doctors didn’t want to attribute deaths to the vaccines, and directed them to the Coroner to certify instead. What do you think?
Oh! I forgot! Here is the latest provisional (incomplete) death data versus the “If Covid never happened” baseline, to be parsed later…

* This baseline allowed for changes in population and expected mortality at each single age, projecting both forward into 2023. The seasonal shape of the baseline curve was based on the 2015-19 experience.