Victorian Vaccine Deaths
Don't sell me 'safe & efficacious' claims from studies if they haven't reported on post-rollout deaths in their vaccinated vs unvaccinated cohorts, nor on differing covid attack rates.
[This article will be continuously amended over the next week as I see the typos and find better ways to express and explain. Best viewed in the browser, later.]
We suspect a lot of the post-vaccine-rollout deaths are silently included in the death totals, as informed by
reports from Norway of many deaths of frail aged care residents to the vaccines expanded on here “Vaccine Deaths in the Frail Elderly”,
hospital separation data linked to vaccines expanded on here “Vaccine Carnage Reported by Australian Hospitals”,
anecdotal report,
many published case reports, and
over 1,000 suspected covid-19 vaccine related deaths reported to the TGA’s DAEN database. The TGA has only acknowledged 14 for the whole of Australia.
Given the deaths haven’t been acknowledged it takes some parsing of the data to see where they are.
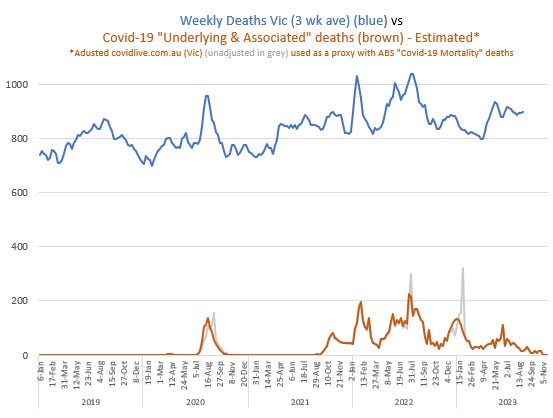
Firstly, please see this comparison of Weekly Deaths in Victoria from 2019-2023 vs Estimated Covid-19 deaths, both “from and with” (underlying and associated cause"). The coincident peaks stand out clearly - Jul/Aug 2020, Jan/Feb 2021, across a long winter in 2022, and a smaller peak across Christmas 2022/23.
Notice the sharp incline in deaths from ~April 2021.
Secondly, see where the vaccination of the frail elderly took place.
I recently reported on two studies on Covid-19 in Residential Aged Care Facilities (RACFs) in Victoria, here, here & here. Yap et al (paywalled) reported that most of their residents were Fully Vaccinated (2 doses) across the April-June 2021 period. Muleme et al provided advice (on a graphic image) that 3rd doses (boosters) were available to residents from ~31 October 2021. Most RACFs are under federal jurisdiction and the rollouts would’ve occurred over a similar timeframe, at least on the east coast.
Here is an image with the times marked on the graph. The Dose 1 & 2 rollout reported by Yap et al occurred across that very steep incline in deaths. The boosters were available from the peak of a Delta outbreak in spring 2021, the outbreak over which Yap & Muleme reported RACF covid-19 deaths.
Thirdly, see what normally drives seasonal changes in death numbers in Victoria.
It is instructive to see an overlay of the % of Australians reporting “Fever & Cough” on the deaths graph. The derivation, interpretation and logic behind the use of this %Fever&Cough index was covered in great detail in my substack “The Vaccine Deaths are Clear in the Data”. Before the pandemic the %F&C largely represented seasonal influenza and colds. After the pandemic covid-19 could also be part of %F&C.
In the graph below, from 2019, I’ve used the % of Victorians with Fever and Cough. The covid-19 outbreaks in 2020 and 2021 manifested while the community was in lockdown, and were predominantly confined to the RACF essential workplaces with their challenging conditions for restricting infection. Thus there is no leap in the public %Fever&Cough until Victoria opened up in late 2021 and rampant community spread began. From this time the coincidence in %Fever&Cough and covid peaks becomes apparent.
Fourthly, take all the covid-related deaths out of the totals, to make unexpected deaths stand out more clearly.
While we are quite lucky in Australia, from a data perspective, given most of the rollout occurred in the near-absence of general community covid and flu, it’s informative to subtract the covid-related deaths from the total deaths. I’ve conservatively used ‘estimated covid deaths for both underlying and associated causes, and also added 15% (conservatively) to allow for concurrent non-covid deaths occurring in RACFs as a consequence of conditions, and perhaps treatments of some kinds.
The Victorian deaths, thus clean of any possible association with covid, are represented in the graph below. I have left shadows of the former death & covid lines, and also of the %F&C line, because the covid element has been removed from consideration. As you can see there is a huge and clear discrepancy between an expected mortality and actual mortality in 2021, reaching across to 2022. If I had a %Fever&Cough index representing only flu and colds I think the discrepancy in 2022 and 2023 would be clear also.
For a reminder of the vaccine rollout periods, I replaced them on the ‘cleansed of covid-19 deaths’ graph below. The massive discrepancy coincides with the RACF rollout, and the 3rd Dose rollout also seems to coincide with a new peak.
Fifth, medical practitioners have reported suspected vaccine deaths to the TGA’s adverse events database (over 1,000 to date). Seeing their date of reports draws the focus to the time that needs to be examined.
Sixth, anecdotes.
I have no doubt whatsoever that there were a large number of deaths in RACFs in Victoria as a consequence of the vaccine rollouts. I have my own piece of anecdotal evidence related to a local RACF. The report was that over a period when typically 1, 2 or rarely 3 residents might die, in 2021 there were 17 deaths. I’ve heard many similar anecdotes.
My issue is that studies in science don’t include this early deathly outcome of the vaccines in their safety and efficacy assessments. Neither Yap et al nor Muleme et al reported on pre-covid deaths in their RACFs as a possible or likely consequence of the vaccines, or even the 3rd doses in the post-covid times, particularly in covid-negative residents.
Removing the “3 week average” from the cleansed Victorian death numbers, and bringing the graphs together, look at the dramatic increase in deaths coincident with the RACFs rollout.
The End.


Thanks for your efforts...